
How Kubernetes Actually Works — And Why Most Engineers Only Know Half of It
The mental model that changes how you debug, scale, and design distributed systems on K8s

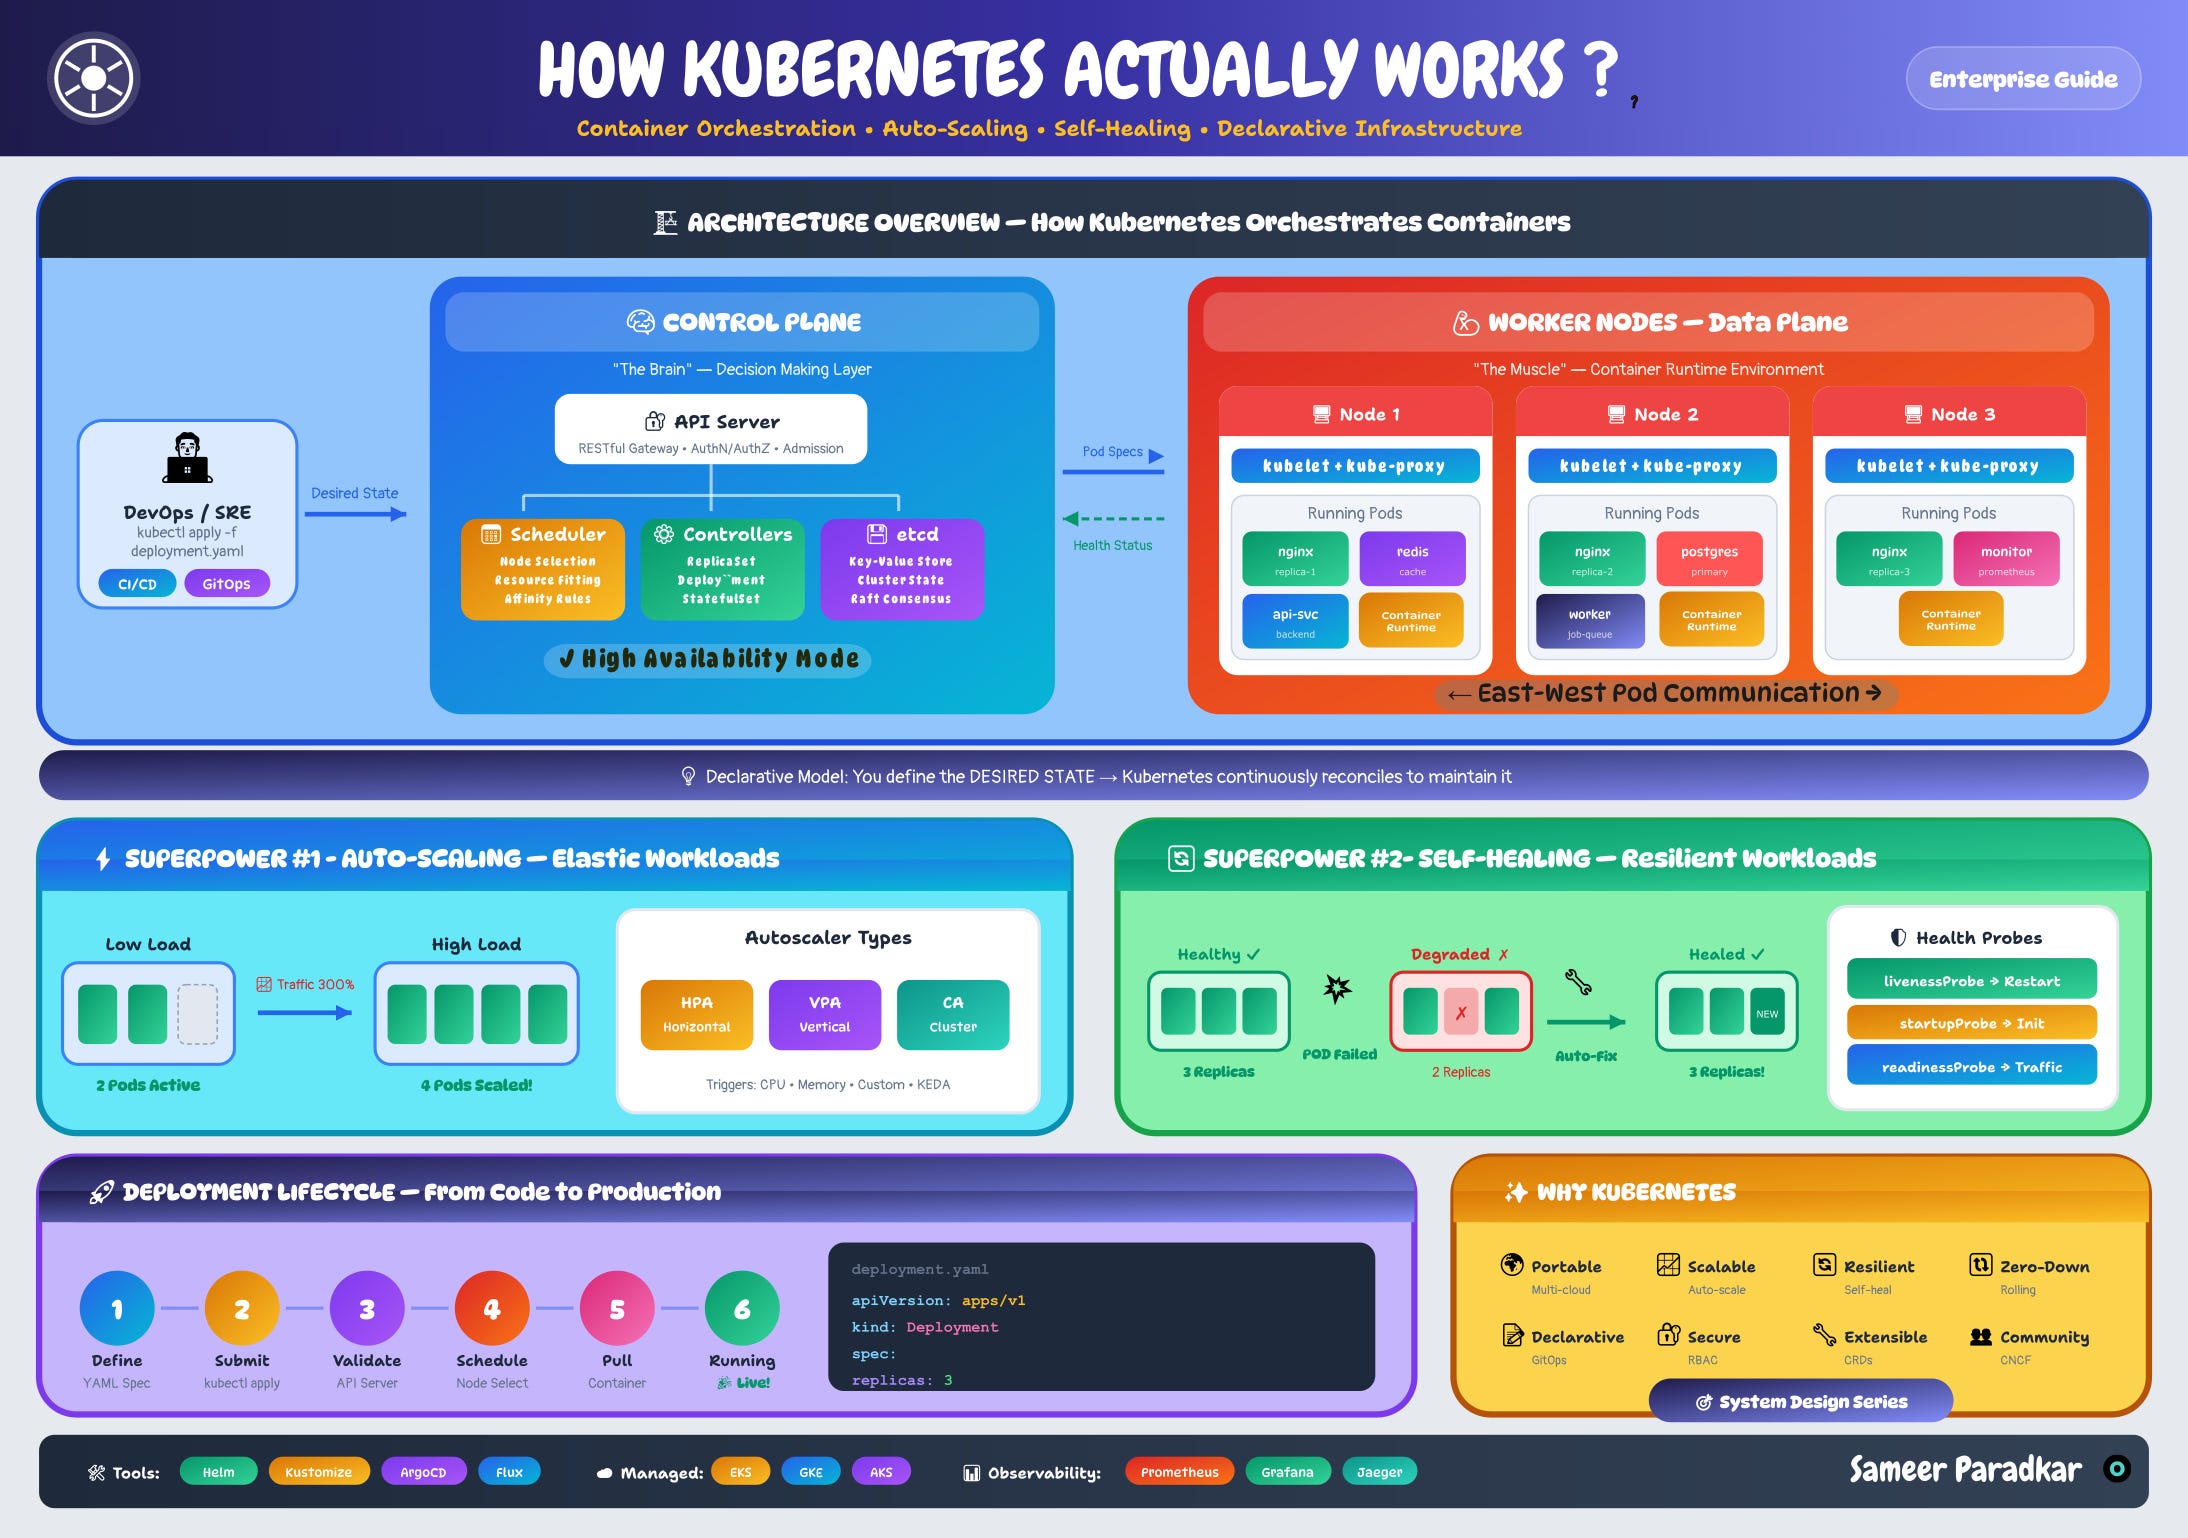
Caption: How Kubernetes Actually Works — Control Plane, Worker Nodes, Auto-Scaling, Self-Healing, and Deployment Lifecycle.
Here’s a number that should make every engineering team pause: the majority of Kubernetes production incidents are caused not by bugs in Kubernetes itself, but by misconfiguration — missing resource limits, unconfigured health probes, and poorly understood scheduling behaviour. The tool works exactly as designed. Engineers just don’t understand the design.
Knowing how to deploy to Kubernetes and knowing how Kubernetes works are two completely different things. Most engineers learn the first. Very few invest in the second. This article is for the second group — because understanding the architecture changes everything about how you debug, scale, and design systems on top of it.
The Mental Model That Changes Everything
Kubernetes is not a deployment tool. It’s a reconciliation engine.
You don’t tell Kubernetes what to do. You tell it what you want — the desired state — and Kubernetes continuously reconciles actual state against that desired state, forever, automatically, without human intervention.
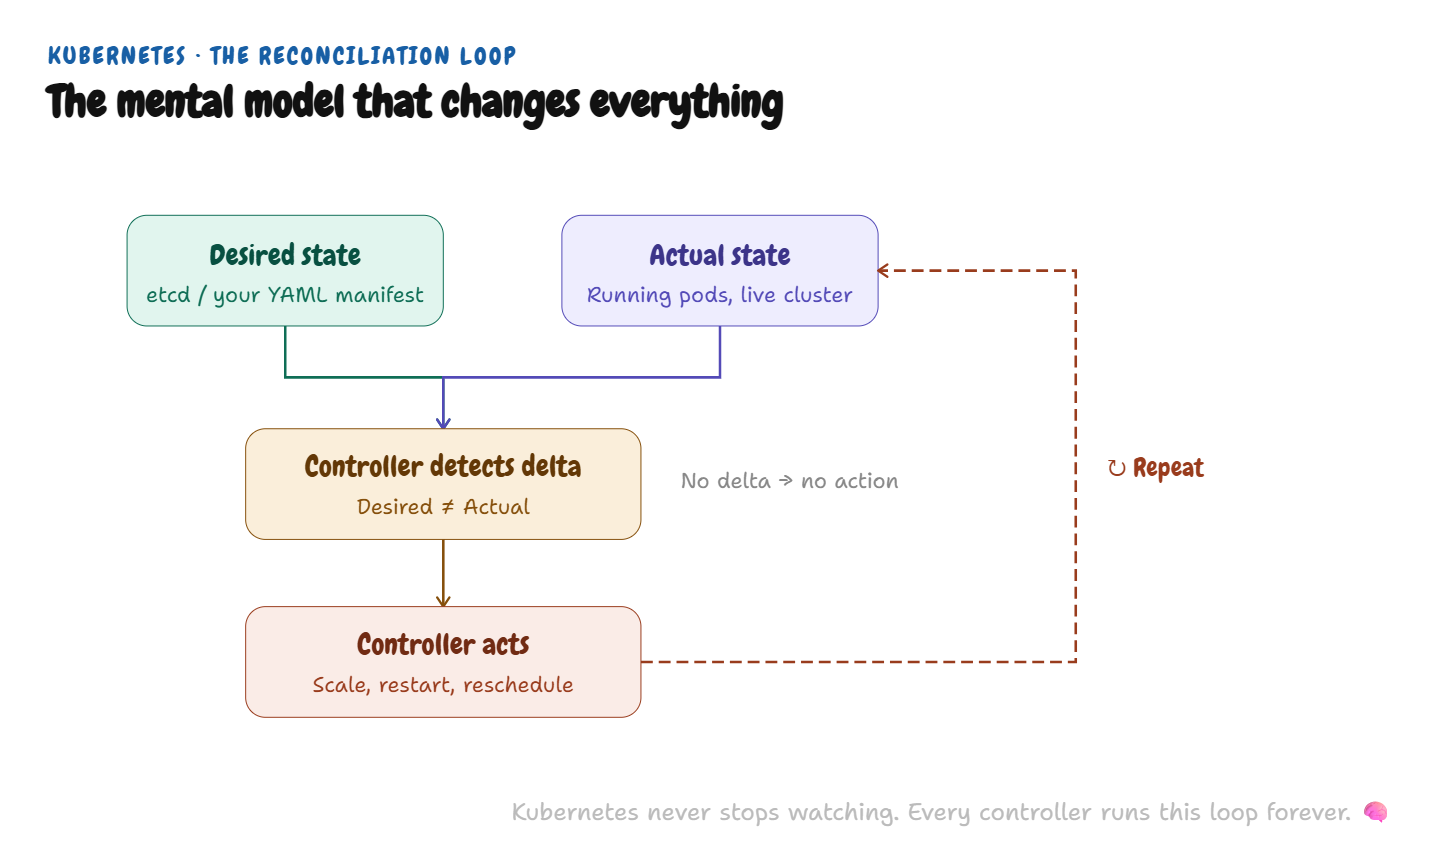
This distinction sounds subtle until you’re debugging a production issue and you’re asking the wrong question. “Why isn’t my pod starting?” is the wrong question. The right question is: “What is Kubernetes trying to reconcile, and what is preventing it from getting there?”
Every K8s behaviour — scheduling decisions, pod restarts, scaling events, node evictions — is the reconciliation loop doing its job. Once you internalise this, the system becomes predictable. Before you do, it feels like magic and occasional terror.
The Architecture: Brain and Muscle
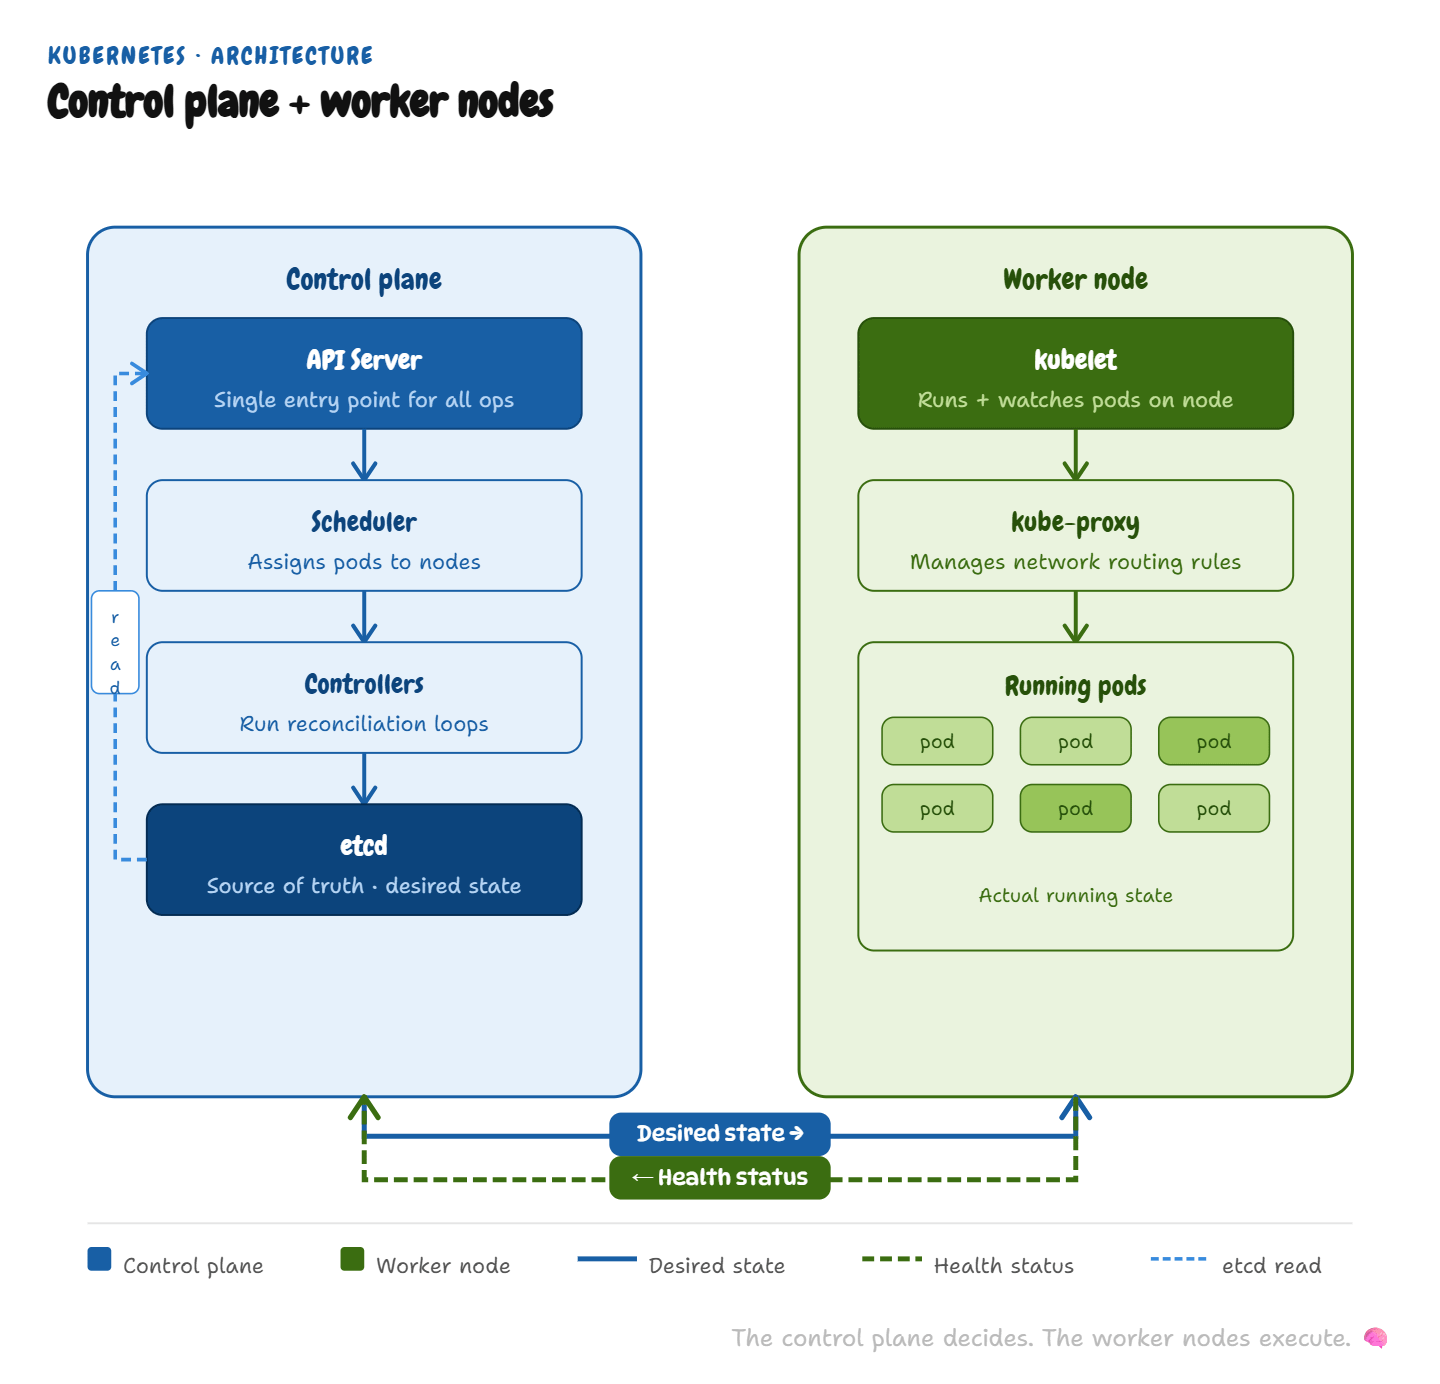
Kubernetes has two layers with distinct roles.
The Control Plane is the brain. Four components, each with a specific job:
API Server — the single entry point for all cluster operations. Every
kubectlcommand, every GitOps push, every admission webhook — everything goes through the API server. It validates, authenticates, and persists to etcd.Scheduler — watches for unscheduled pods and assigns them to nodes based on resource availability, affinity rules, taints, and tolerations. It doesn’t start pods. It makes the assignment decision.
Controllers — the reconciliation workers. ReplicaSet controller ensures the right number of pods are running. Deployment controller manages rollout strategy. StatefulSet controller handles ordered, stateful workloads. Each controller watches its resources and acts on deviations from desired state.
etcd — the source of truth. A distributed key-value store using Raft consensus. Everything the control plane knows about cluster state lives here. If etcd is unhealthy, the cluster can still run existing workloads — but no new scheduling or reconciliation happens.
The Worker Nodes are the muscle. Each node runs two agents:
kubelet — receives pod specs from the API server, instructs the container runtime to start/stop containers, and reports pod health back to the control plane.
kube-proxy — manages network rules on each node, enabling east-west pod-to-pod communication and north-south service routing.
The control plane never touches your workload directly. It manages state. The worker nodes run it. This separation is why Kubernetes can survive partial failures — a control plane disruption doesn’t kill running workloads; it just pauses new scheduling decisions.
The Two Superpowers — And How Most Teams Underuse Them
Superpower #1: Auto-Scaling
Kubernetes has three independent scaling mechanisms, each operating at a different layer:
Horizontal Pod Autoscaler (HPA) scales replica count based on CPU utilisation, memory pressure, or custom metrics from Prometheus. This is the one most teams configure. Set a target CPU utilisation, define min and max replicas, HPA handles the rest.
Vertical Pod Autoscaler (VPA) adjusts resource requests and limits per container based on observed usage. Most teams don’t use this — which means most teams have containers either over-provisioned (wasting money) or under-provisioned (causing OOM kills at peak load).
Cluster Autoscaler (CA) adds and removes nodes based on pending pod pressure and node utilisation. When HPA scales up pods and there’s no capacity, CA provisions new nodes. When utilisation drops and nodes are underused, CA drains and terminates them.
The insight most teams miss: HPA and CA work together but with different timescales. HPA reacts in seconds. CA takes minutes to provision new nodes. If your traffic spikes faster than CA can provision, pods stay pending. The fix is not to disable auto-scaling — it’s to maintain a buffer of headroom capacity so HPA can scale into existing nodes before CA needs to act.
Superpower #2: Self-Healing
Self-healing in Kubernetes isn’t one mechanism. It’s three probe types working in concert:
Liveness Probe — “Is this container alive?” Fails → kubelet kills and restarts the container. The trap: a liveness probe that’s too aggressive will restart healthy containers under load, causing cascading failures. Tune your failure thresholds.
Readiness Probe — “Is this container ready to serve traffic?” Fails → kubelet removes the pod from service endpoints. No traffic reaches it until it passes. This is your primary tool for graceful rollouts and graceful degradation.
Startup Probe — “Has this container finished initialising?” Protects slow-starting containers from premature liveness probe failures during init. If your service takes 60 seconds to warm up and your liveness probe fires after 30, your pod will never start successfully.
The war story worth knowing: A high-scale fintech running Java services on Kubernetes was seeing intermittent pod restarts during peak traffic hours. The team spent two weeks investigating memory leaks and GC tuning. The actual cause: liveness probes timing out during GC pauses under load, triggering restarts, which increased load on remaining pods, which caused more GC pauses. The fix was increasing the liveness probe failure threshold from 3 to 5 — a one-line change. Two weeks of investigation, one line to fix.
Misconfigured health probes are the most common cause of self-inflicted Kubernetes incidents. Configure them on every container, tune them for your actual startup and response time characteristics, and test them deliberately.
The Deployment Lifecycle — Six Steps From YAML to Running
Every production incident in Kubernetes traces back to one of six steps:
Define — YAML spec declaring desired state (image, replicas, resource limits, probes)
Submit —
kubectl applyor GitOps push sends spec to API serverValidate — API server runs admission webhooks and validation (this is where policy violations surface)
Schedule — Scheduler selects a node based on available resources and affinity rules
Pull — kubelet pulls the container image on the target node
Running — container starts, probes begin, pod joins service endpoints when ready
When a deployment fails, your first question should be: which step failed? A pod stuck in Pending is a scheduling problem (step 4) — not enough resources, wrong node affinity, taint not tolerated. A pod in ImagePullBackOff is step 5 — image doesn’t exist or registry credentials are wrong. A pod in CrashLoopBackOff is step 6 — the container starts and immediately exits.
The diagnosis mental model: kubectl describe pod shows you the event log for steps 1–5. kubectl logs shows you what happened in step 6. Use both, in that order.
What to Do on Monday
Audit your resource limits. Every container in production should have CPU and memory requests and limits defined. No exceptions. Containers without limits can consume unbounded resources and starve neighbours on the same node.
Audit your health probes. Every container should have at minimum a liveness and readiness probe. Check your failure thresholds against your actual response times under load — not your p50 response time, your p99.
Check your HPA configuration. If you’re using HPA with only CPU metrics, consider adding custom metrics from Prometheus. CPU is a lagging indicator. Request rate or queue depth often gives you faster, more accurate scaling signals.
Understand your etcd. If you’re running self-managed Kubernetes, your etcd backup and recovery procedure should be documented and tested quarterly. An untested backup is not a backup.
The Quotable Truth
Kubernetes doesn’t automate your operations. It makes your operations declarative. The automation comes from you defining the desired state precisely enough that the reconciliation loop can maintain it without human intervention.
The engineers who get the most out of Kubernetes aren’t the ones who know the most commands. They’re the ones who understand the reconciliation model deeply enough to express their operational intent in YAML — and trust the system to maintain it.
Before You Go
If this reframed how you think about Kubernetes, share it with the engineer on your team who’s still treating it like a fancy deployment script. They’ll thank you later.
Drop a comment with your most painful Kubernetes misconfiguration war story — I read and respond to every one.
And if you want deep-dives like this every week — systems design, architecture decisions, and the engineering knowledge that takes years to learn the hard way:
→ Subscribe to oolooroo.substack.com — new deep-dive every week.